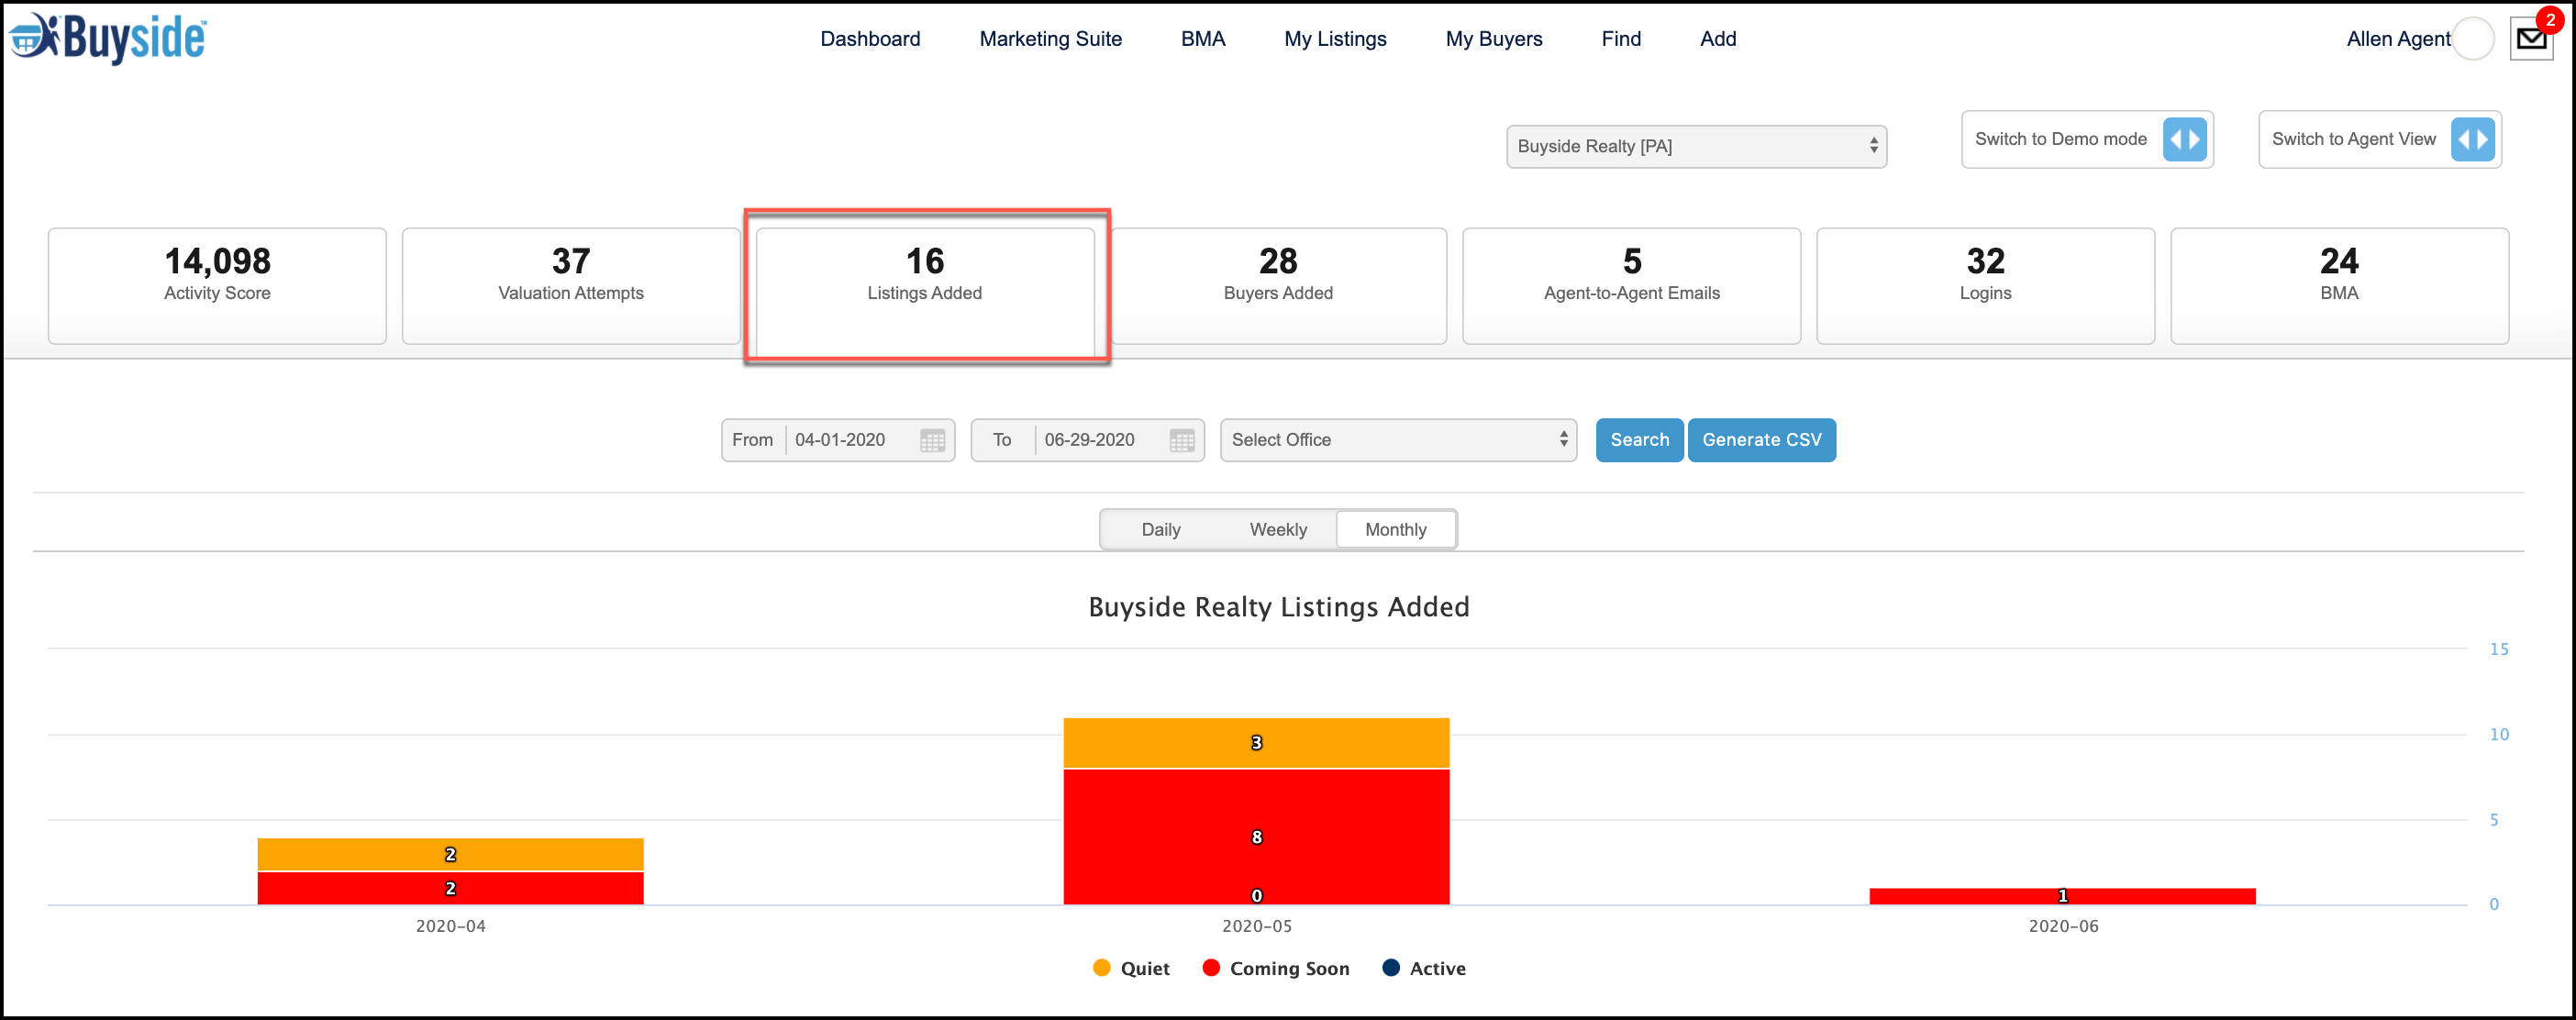
This section of the manager dashboard consists of the total number of listings that have been added by your brokerage.
- Distinguished by color, this graph displays the total number of quiet, coming soon, and active listings that have been added by your brokerage. You can decide if you would like to view daily, weekly, or monthly data.
Admin Dashboard: Reviewing Listings Added - 1-Pager
(Click here to download)
Comments
Please sign in to leave a comment.