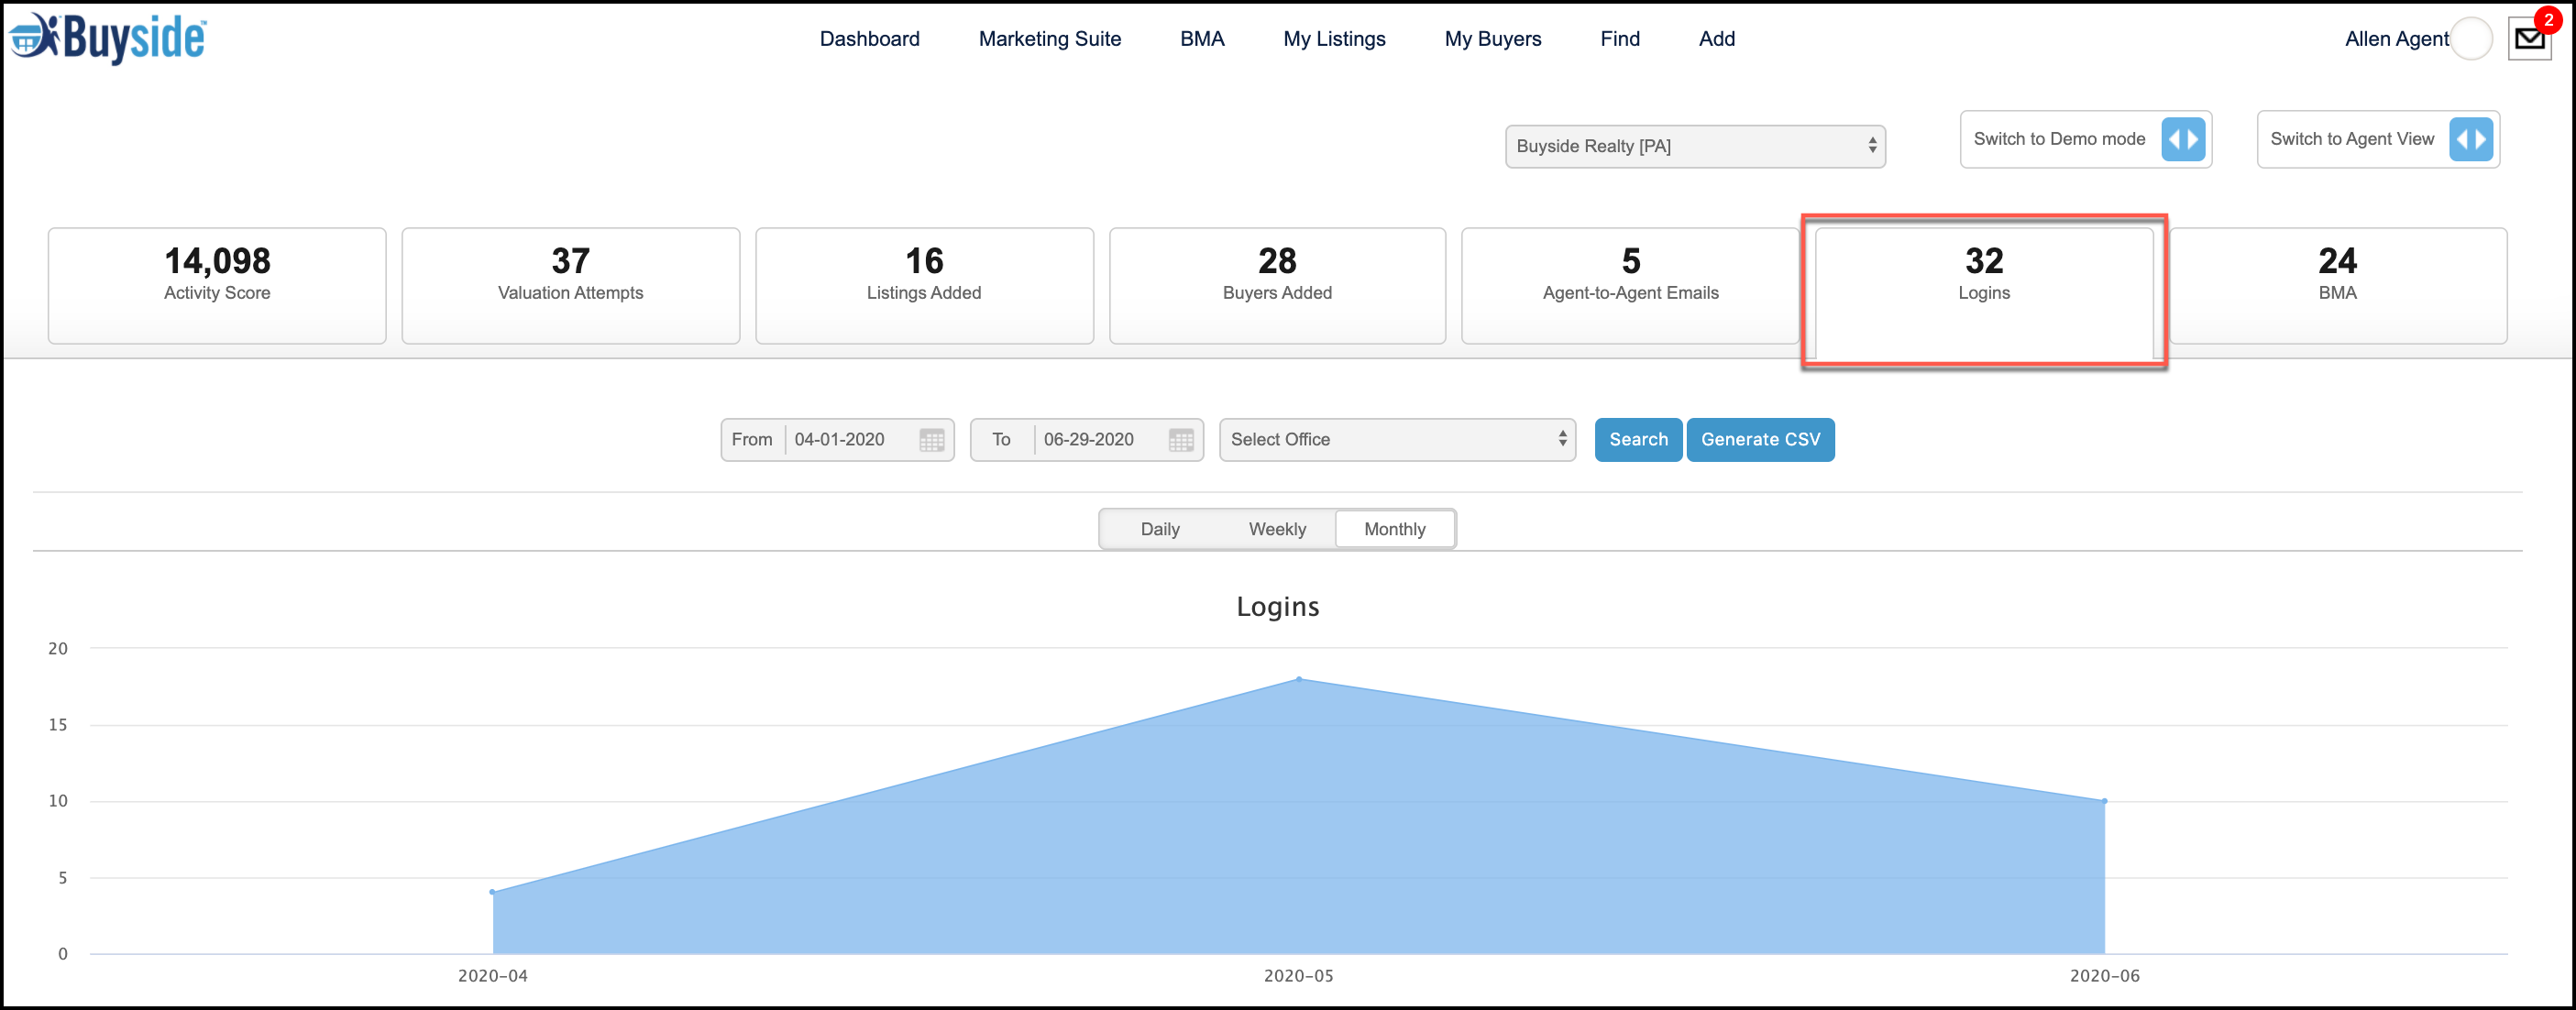
This part of the dashboard calculates the total amount of logins in your brokerage.
- This graph displays the total amount of logins in your brokerage, so that you can gauge the engagement of your agents on the app. It is calculated by the amount of times an agent logs on to the platform and you can decide if you want to view the data by day, week, or month.

Based on how many logins your brokerage or office has, you can get a better idea of the level of engagement on the platform!
Admin Dashboard: Reviewing Logins - 1-Pager
(Click here to download)
Comments
Please sign in to leave a comment.